
Gas Mileage of a Toyota Corolla – Data Analysis Over 6 Years!
I kept track of the mileage, gallons of gas, date, and miles per gallon (mpg) in my 2004 Toyota Corolla CE 5-speed Manual transmission, over the course of over 6 years and 125,000 miles.
I then crunched the numbers to get a very granular look at what sorts of gas mileage I was getting, as well as how the mpg changes with the seasons. I found it quite interesting!

I collected data fairly religiously from February 2009 to March 2015, which added up to a total of about 125,000 miles.
I started recording when the odometer hit just over 101k miles, and the analysis includes the odometer hitting 226k miles (the vehicle is still going by the way, up to 267k miles).
I did miss recording a few fills here and there, so I have removed those outliers from the analysis.
Interesting patterns emerged when I finally sat down and looked at all the numbers together.
Things like average mpg in the summer vs winter, and typical vehicle range were calculated, giving some somewhat surprising, but consistent results.
Here are the results of this detailed analysis!
Types of Driving and Types of Gas
This vehicle spent about 75% on highway miles and 25% city miles. Driving occurred in the northern US, namely North and South Dakota, Minnesota, and Wisconsin, across all seasons.
It averaged about 21,000 miles per year. The gas used was almost exclusively 87 octane, from a variety of different gas vendors. For purposes of calculating the mpg, I would let the tank fill until the gas shutoff kicked in (without “topping off’ the tank).
Then I would record the distance traveled since the last fill, and the amount of gasoline put in the tank. The mpg calculation is pretty straightforward, but I’ll include it here for purposes of completeness:
MPG = Miles Driven Since Last Fill / Gallons Put in Tank
There could be some discrepancies in this method, since the valve shut-off may occur at different times based on different mechanisms at different gas stations.
What I mean by that is that every fill, the amount that was recorded may differ slightly from what was actually used, since the tank may not have been filled completely sometimes, and other times it was filled more completely than others.
I assume that this accounts for some of the spread in the data, and also that these sorts of affects will average out over the data.
Miles per Gallon (mpg) Data and Trends
The average miles per gallon over all 6 years was 36.0 miles per gallon (15.3 km/l).
I have been fairly pleased with this value which represents over 3,400 gallons of gas (and over $7,500)!
For example, if the mpg had been slightly lower, say 30 instead of 36, this would have required an extra 100 gallons per year, at current gas prices ($2.25/gallon as of the time of this writing) that was a savings of $225/year, or $1500 over 6 years.
The average mpg doesn’t really tell the whole story, since the rate changed from Summer to Winter. There is some difference of opinion on what causes the differences between summer and winter mpg rates.
Some people cite environmental factors (e.g. increased aerodynamic drag due to denser air in the winter) and others talk about winter vs summer gasoline blends.
Here is a plot of the mpg vs dates in the range where I kept track, along with a moving average of 10 readings (red line).
Each dot represents the mpg calculated at each tank fill. There is quite a bit of variability over the years.
MPG Variation per Month

Here is a histogram showing the distribution of various mpg rates.
MPG Histogram

It has been interesting to see the miles per gallon value change in a consistent pattern from summer to winter over the years.
This website by the Department of Energy has a good summary of some of the environmental factors that make mileage worse in the winter, including:
- Increased engine friction due to cold oil.
- Takes time for engine to reach ideal efficiency temperature.
- Increased aerodynamic drag due to denser winter air.
- Decrease alternator/battery performance in the cold.
- Winter grade gasoline has lower energy per gallon.
For this reason, I broke down the average mpg calculations to arrive at a value for summer and one for winter.
MPG: Summer vs Winter
The cutoffs for gas stations changing from winter to summer fuel blend mixtures are June 1st and September 15th, so I used those dates in the analysis.
To make sure that there was not some carry-over of gas in the tanks during the switch-over periods, I eliminated June and September from the summer/winter average calculations.
The average summer mpg (July 1st – Aug 31st) was 37.9 mpg.
The average winter mpg (Oct 1st – May 31st) was 35.2 mpg.
So, there was a difference of 2.7 mpg from summer to winter.
You can see that over the 6-year range, the best gas mileage occurred around August (indicated by blue arrows up), and the worst occurred around February (indicated by red arrows down).

Breaking it down a little further, the average mpg in February was 33.3 mpg, and the average mpg in August was 38.1 mpg.
Indicating that the change was pretty drastic between these two months, almost 5 mpg difference!
One further method of analysis is to look at the effects of fuel blends. It would stand to reason that if the main factor to reduced fuel efficiency in the winter months was due to the fuel blend, then the mpg would remain fairly constant over the winter months and also fairly constant over the summer months.
However, since the timeline plot seems to indicate some variability even within the summer and winter, I wanted to see what sorts of differences in mpg there were based on month.
Also, along those lines, I wanted to check to see how these values compared to the average temperature in each month, so I obtained the average temperature data from the Minnesota DNR.
The following is a plot showing the variation in mpg vs month of the year (the gray bars) as well as the average temperature in those months over those years (red line).
The mpg tracks pretty closely to the temperature, except for the summer, where it appears to level off a bit, and actually dip during July (extra use of the air conditioning, perhaps?).
MPG vs Outside Temperature

I found this trend pretty interesting.
Typical Range of a Toyota Corolla
Gas fill-ups were usually done when the “low fuel” light came on (I found that you could safely drive another 50 miles after the low fuel light came on). Sometimes I would drive beyond that, or sometimes I would fill prematurely, but this gave an estimate of the typical range I was getting on one tank of gas.
I removed the outliers (from the low end) from this histogram, in order to give a more typical representation of the range. Usually, the Corolla would give ~ 400 miles on one tank of gas.

Ways to Improve Fuel Economy in a Corolla
Okay, now that we’ve looked at some of the data, what are some ways to improve fuel economy?
Improving Fuel Economy Overall
- Limit erratic driving. Practice “calm” driving. This is probably the number one step to take to reduce fuel consumption. Various studies suggest that this can affect your mpg by about 35%.
- Resist the temptation to gun it when accelerating from stop signs and red lights. When you see a red light ahead, practice the art of coasting to a stop, rather than maintaining speed until the end, and braking hard.
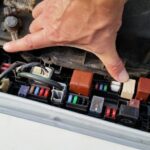
- Consider getting a driving dongle for your OBDII port. This, coupled with an app on your phone can give you real-time feedback on your driving habits. This will reduce fuel and save on brakes.
- Remove excess dead weight from the vehicle. Are you carrying around a box of old textbooks in your trunk? How about excessive amounts of tools? Lose the dead-weight and watch your fuel economy increase.
- Remove accessories that increase wind resistance, such as roof racks, etc… An empty roof rack can decrease mpg by about 5-15%.
- Replace or clean the engine air filter. Let your car breathe! Replacing a dirty air filter can increase mpg by up to 10%.
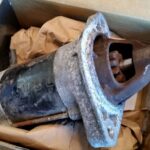
- Clean the Mass Airflow (MAF) Sensor. Your vehicle’s computer adjusts the fuel usage based on the measurements of the MAF. A dirty sensor can screw up the readings. Take 10 minutes and clean it yourself.
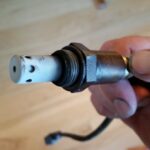
- Fix any problems causing a “Check Engine Light.” Get an OBDII reader and find out what is causing the error. For example, P0133 and P0134 codes indicate a problem with the Oxygen sensor. Faulty oxygen readings in your exhaust system can also decrease gas mileage.
Improving Winter Fuel Economy
Here are a few suggestions for maintaining maximum fuel efficiency in the winter.
- Maintain proper tire pressure. Check your owner’s manual and maintain the proper tire pressure. Remember, the tire pressure usually drops when it gets colder, so double check tire pressure in the fall and early winter and fill the tires accordingly.
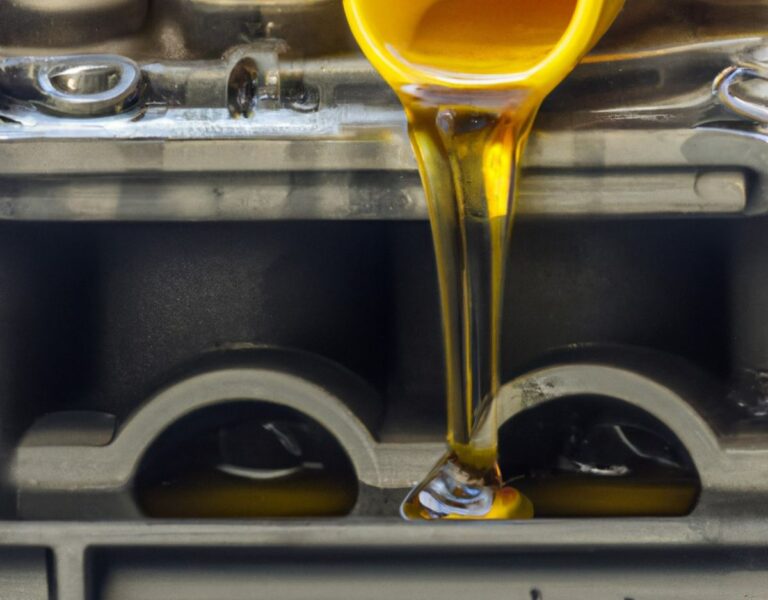
- Use recommended oil for driving in colder conditions. Colder temperatures cause oil to thicken up, until the vehicle is warmed up. Consider changing to a lighter oil in the winter.
- Minimize excessive idling time. The vehicle warms up more quickly while being driven. Most vehicle manufacturers recommend gentle driving after 30 seconds of warm-up time.
- If possible, park the vehicle in a warmer place when not being used, such as a garage.
Conclusion
I hope you found the information in this article interesting.
If you have a similar Toyota Corolla, check out more information on 9th generation 2003-2008 Toyota Corolla maintenance, check out these articles:
Maintenance Articles on 2003-2008 Toyota Corollas
Other items of interest:
For more information on 7th generation (2002-2007) Honda Accord maintenance, check out these articles:
Maintenance Articles on 2002-2007 Honda Accords


Super cool! I drive a 2003 Corolla for my daily commute, mostly stop and go traffic. For the past 5 years, I got 20mpg on average. Recently the 5 year old battery died, so I got a new one. All of a sudden, I now get 26-27mpg.
I have to say, I also tried multiple things a few months back to improve the mpg, including new air filter, new PCV, cleaning the MAF sensor, Techron fuel system cleaner, etc.
That’s super interesting. I have heard a faulty battery can cause the alternator to have to work harder to keep the battery charged, using more gas. Also fuel injectors may not work as efficiently with weaker voltage, resulting in incomplete combustion and more gas usage. Thanks for the data point, I’m amazed it made that much of a difference!
Fascinating!